Back to Asset Essentials Main Menu
Maintenance Insights
The Maintenance Insights dashboard gives you a flexible look at your organization's KPIs. The dashboard is made up of multiple sheets which provide a detailed look at KPIs related to overall maintenance, as well as assets, across various dimensions, and highlight missing data in common work order and asset fields.
Accessing Maintenance Insights
-
Login to Asset Essentials.
-
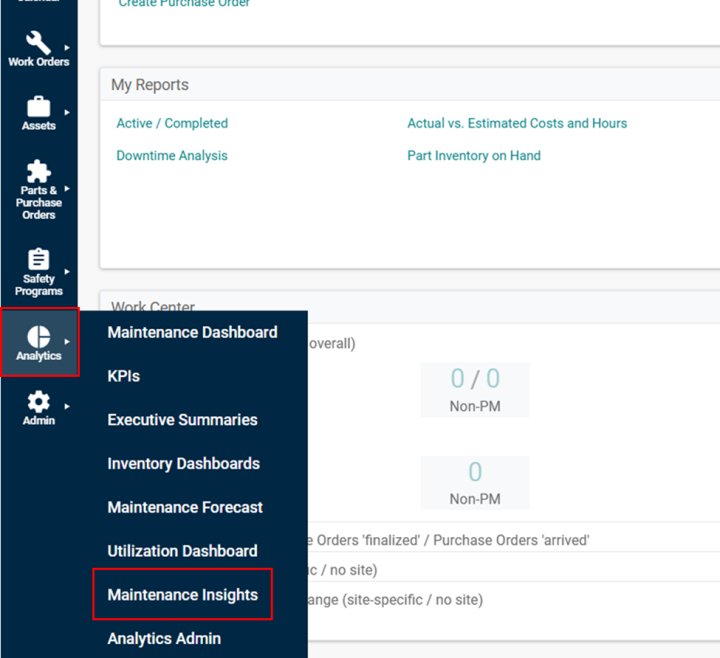
Click Analytics, select Maintenance Insights.
-
The Maintenance Insights dashboard appears, proceed to next section.
Work Order Overview
KPIs
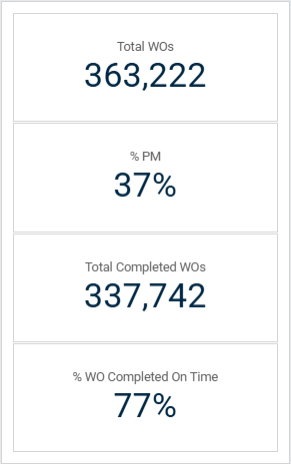
These key performance indicators provide a snapshot of the current trends associated with your organization’s maintenance.
-
Total WOs: This KPI shows the total number of Work Orders within the dashboard timeframe.
-
% PM: This KPI shows the percentage of the total work orders originated in the time frame that are Preventive Maintenance (PM) work orders.
-
Total Completed WOs: This KPI shows the total number of Work Orders within the dashboard timeframe that have been completed. A completed work order is a work order that has a value for Work Order Status Category equal to “Completed,” “Completed Pending Approval,” or “Archived.”
-
% WOs Completed on Time: This KPI displays the percentage of Completed Work Orders that were completed on time, which is defined as work orders where the completed date is less than or equal to the expected completion date.
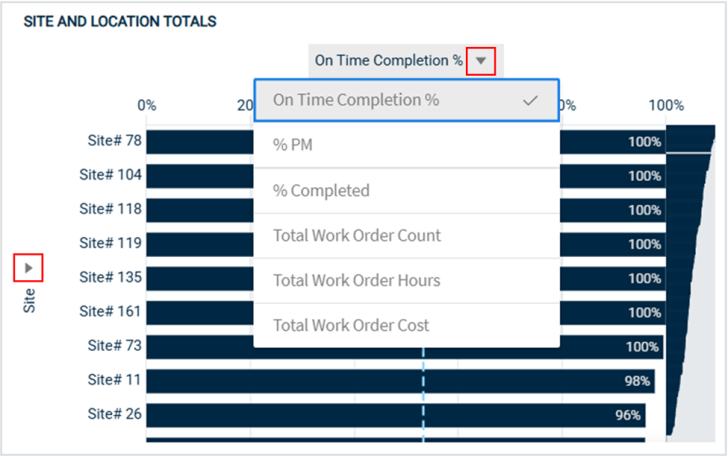
Site and Location Totals
This chart provides various KPIs by both Site and Location. There is the ability to toggle to Sites or Locations using the dropdown on the left side of the chart and/or toggle to different KPIs by using the dropdown on the top of the chart.
The available KPIs include the following:
-
On Time Completion %: This KPI displays the percentage of Completed Work Orders that were completed on time, which is defined as work orders where the completed date is less than or equal to the expected completion date.
-
% PM: This KPI shows the percentage of the total work orders originated in the time frame that are Preventive Maintenance (PM) work orders.
-
% Completed: This KPI shows the percentage of Work Orders within the dashboard timeframe that have been completed. A completed work order is a work order that has a value for Work Order Status Category equal to “Completed,” “Completed Pending Approval,” or “Archived.”
-
Total Work Order Count: This KPI shows the total number of Work Orders by dimension.
-
Total Work Order Hours: This KPI shows the total hours logged on Work Orders by dimension.
-
Total Work Order Cost: This KPI shows the total cost logged on Work Orders by dimension.
There is a dashed light blue line that overlays the chart. This line represents the average value for the selected KPI across all dimensions. This average line will update with whatever filters are selected and can serve as a benchmark to better contextualize and understand a KPI value for a certain site or location.
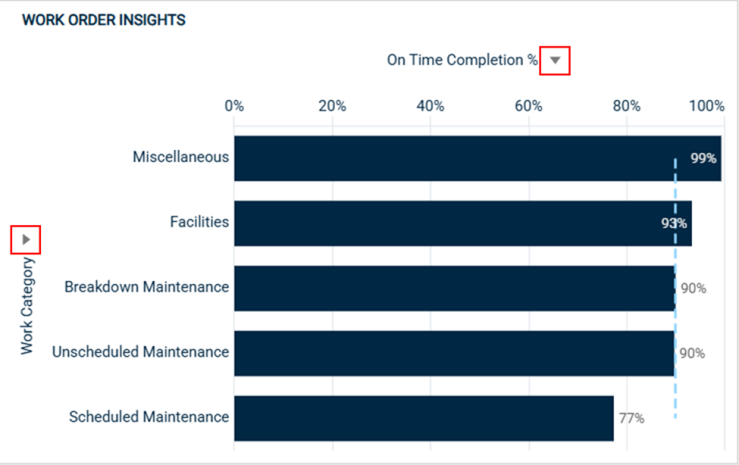
Work Order Insights
This chart shows a few KPIs by various work order fields. There is the ability to toggle to different work order fields, including Work Category, Cause, Problem, and Work Type, using the dropdown on the left side of the chart and/or toggle to different KPIs by using the dropdown on the top of the chart.
The available KPIs include the following:
-
On Time Completion %: This KPI displays the percentage of Completed Work Orders that were completed on time, which is defined as work orders where the completed date is less than or equal to the expected completion date.
-
% PM: This KPI shows the percentage of the total work orders originated in the time frame that are Preventive Maintenance (PM) work orders.
-
% Completed: This KPI shows the percentage of Work Orders within the dashboard timeframe that have been completed. A completed work order is a work order that has a value for Work Order Status Category equal to “Completed,” “Completed Pending Approval,” or “Archived.”
-
Total Work Order Count: This KPI shows the total number of Work Orders by dimension.
-
Total Work Order Hours: This KPI shows the total hours logged on Work Orders by dimension.
-
Total Work Order Cost: This KPI shows the total cost logged on Work Orders by dimension.
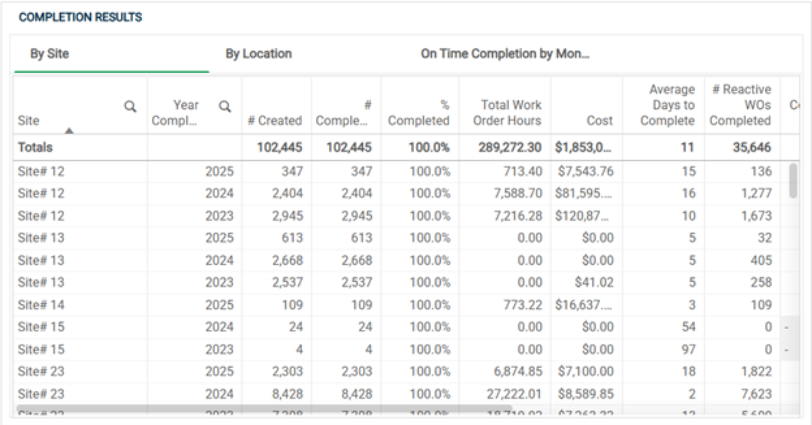
Completion Results
The following container object has metrics and KPIs related to work order completion. The first two tables display various KPIs by Site and by Location, along with the year the work order was completed. Each table includes KPIs around the number and percentage of completed work orders, overall and by Origin, the hours and cost associated with the work order, the average days to complete, and the count and percentage of work orders completed on time.
The final chart, On Time Completion by Month and Year, takes a deeper dive and looks at the percentage of work orders that were completed on time over time. The years are stacked so that you can compare on time completion rates over time. On the left side, there is the ability to toggle between viewing on time completion rates for all work orders, PM work orders only, and Non-PM work orders only.
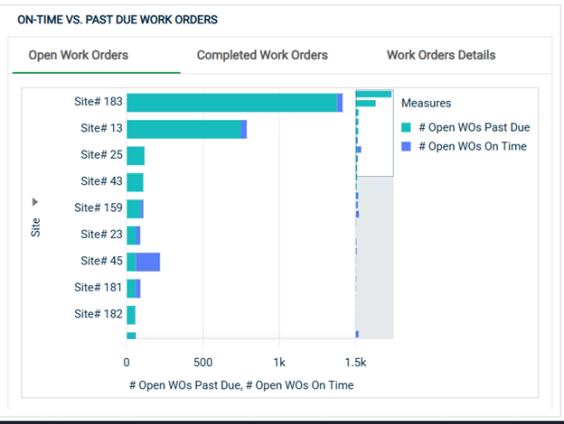
On Time vs Past Due Work Orders
This container object has information related to past due work orders.
The first two charts compare the counts of Past Due and On Time Work Orders for both Open Work Orders and Completed Work Orders. There is the ability to toggle between Site and Location on the left side of the chart. These charts can quickly identify which sites and locations are not completing work orders as quickly as others, indicating that there may be a need for additional resources or staff. Both of these charts are interactive, so if you’d like to investigate a certain site or location further, you can click into a specific site or location and navigate to the third item in this container object, the Work Order details.
The final table, Work Order details provide a table of work orders and their associated dates and statuses. This is especially useful if you want to drill into particular sites or locations to investigate past due work orders. There is also a convenient link in this table that will take you to the work order page in Asset Essentials where you can update or add information that will help you prioritize and close these work orders.
Asset Overview
KPIs
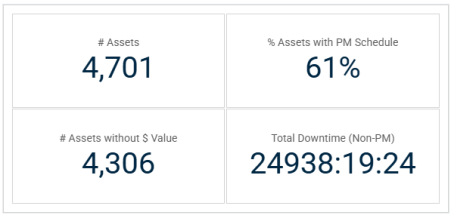
These key performance indicators provide a snapshot of the current trends associated with your organization’s assets. These KPIs will update with filter selections.
-
# Assets: Shows the total number of Assets that have been tied to work orders within the dashboard timeframe. This excludes assets that have not had associated work orders logged within Asset Essentials in the recent past.
-
Assets with PM Schedule: Out of the total number of assets, this represents the percentage that have at least one Preventative Maintenance (PM) schedule that is active in Asset Essentials as of the time of data refresh. This highlights the opportunity available to extend the life of your assets through a PM program.
-
# Assets without $ Value: This KPI shows the number of assets that have neither purchase price nor replacement value logged in Asset Essentials. Knowing the value of your assets is a critical piece of information when considering whether you should repair or replace them.
-
Total Downtime (Non-PM): This is a sum of downtime logged on your organization’s assets over the dashboard timeframe. Downtime is displayed in hours:minutes:seconds. Note: A downtime work order is considered a completed, non-PM work order that is attached to an asset.
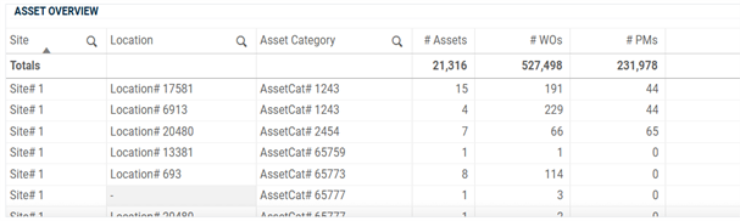
Asset Overview
This displays the counts of assets, work orders, and PM work orders by Site, Location, and Asset Category.
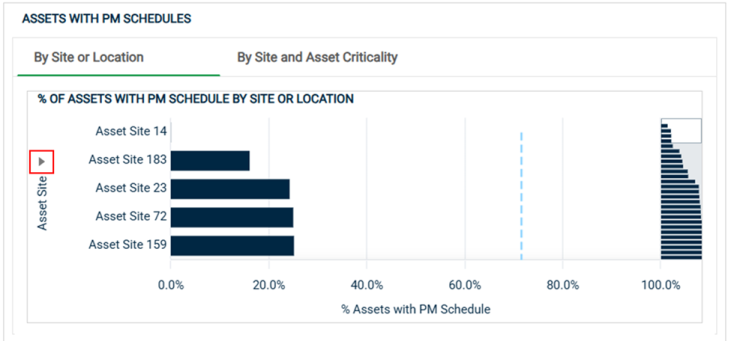
% Assets with PM Schedule
This container object has two charts, both of which present the percentage of assets with an active PM schedule. The first chart shows this percentage by Site or Location, depending on which dimension you select with the toggle on the left. There is a dashed light blue line that overlays the chart. This line represents the average value for the percentage of assets with an active PM schedule across all dimensions. This average line will update with whatever filters are selected and can serve as a benchmark to better contextualize and understand the metric for a certain site.
To dig deeper, the second chart shows this percentage by site and criticality. If a site shows a low percentage of assets with a PM schedule, it may be useful to select that site which will filter the data presented down to only assets at that site. You will then be able to click over to the second chart and investigate how critical these assets are to your organization.
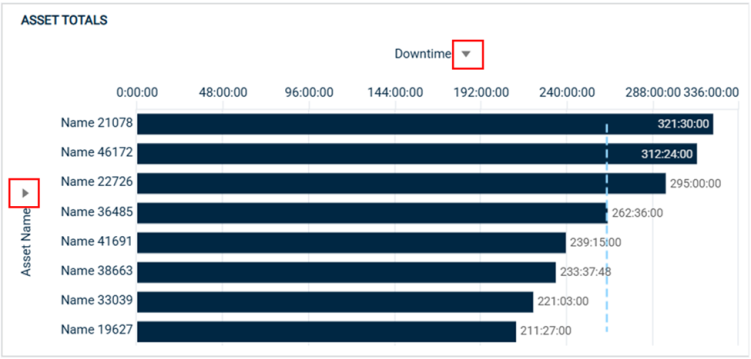
Asset Totals
This chart provides various KPIs by both Asset Name and Asset Category. There is the ability to toggle to Asset Name and Asset Category using the dropdown on the left side of the chart and/or toggle to different KPIs by using the dropdown on the top of the chart.
The available KPIs include the following:
-
Downtime: This is a sum of downtime logged on your organization’s assets over the dashboard timeframe. Downtime is displayed in hours:minutes:seconds. Note: A downtime work order is considered a completed, non-PM work order that is attached to an asset.
-
% PM: This KPI shows the percentage of the total work orders originated in the time frame that are Preventive Maintenance (PM) work orders.
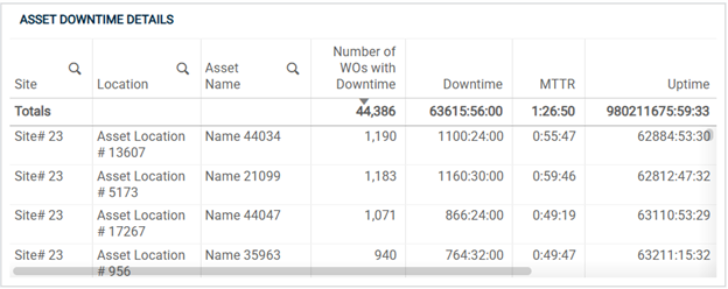
Asset Downtime Details
This chart shows various metrics related to Downtime by Site, Location, and Asset Name. It may provide insight into how assets are performing and clearly identifies where attention might be needed to keep your operations running smoothly. A downtime work order is considered a completed, non-PM work order that is attached to an asset. Runtime is equal to the time that an asset has been running over a time frame, assuming the asset runs 24 hours per day, 7 days per week. If an asset was purchased or added to Asset Essentials after the start of the dashboard timeframe (after January 1st of two years ago), Runtime is defined as the number of hours since the asset was purchased or added to AE. Otherwise, Runtime is the number of hours since January 1st of two years ago, assuming the asset runs 24 hours per day, 7 days per week. Runtime will update to reflect additional date originated selections. Uptime is then derived by subtracting Downtime from Runtime for each asset.
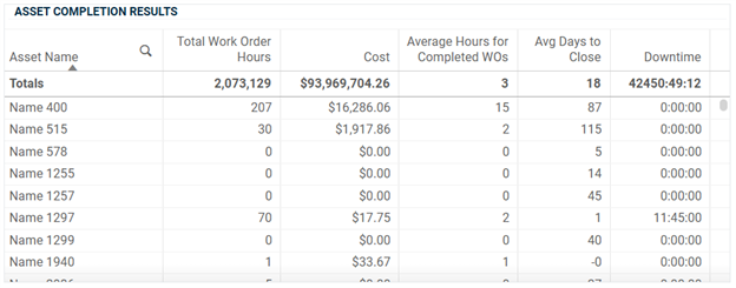
Asset Completion Results
This chart shows various metrics related to Work Order completion by Asset Name.
Reporting Gaps
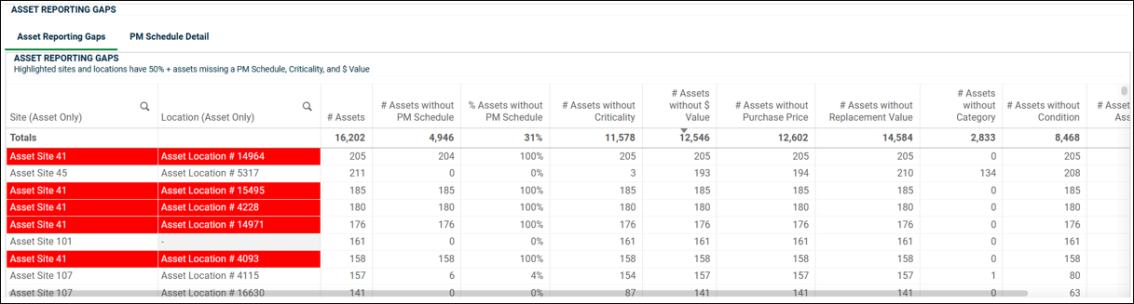
Asset Reporting Gaps
This chart provides an audit of the availability of asset fields by Site and Location, including the presence of an active PM schedule, a value for Criticality, a dollar value (defined as either Purchase Price or Replacement Value), a value for Asset Category, a value for Asset Condition, and a value for Asset Status.
Sites and Locations have been highlighted if they have assets where greater than 50% are missing a PM schedule, greater than 50% are missing a Criticality value, and greater than 50% are missing a dollar value. This allows you to quickly identify sites that have assets that need more attention.
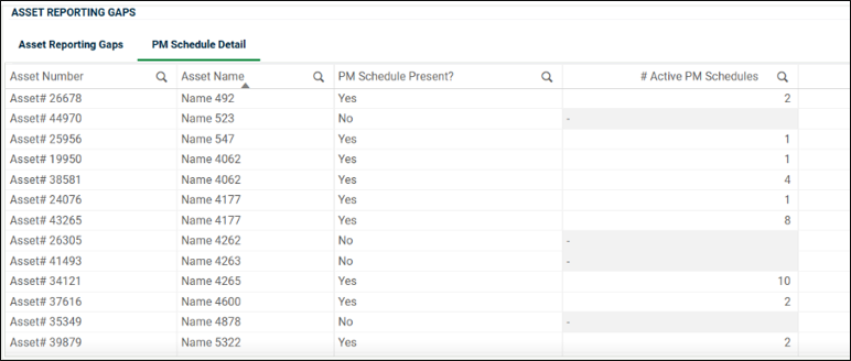
PM Schedule Detail
This chart provides a list of your assets, as well as whether each has a PM schedule and if so, the number of enabled PM schedules attached to the asset, at the time of the dashboard reload.
The assets included in this chart consist of any assets tied to a work order originated in the default dashboard time range, which is the previous two years, plus the current year.
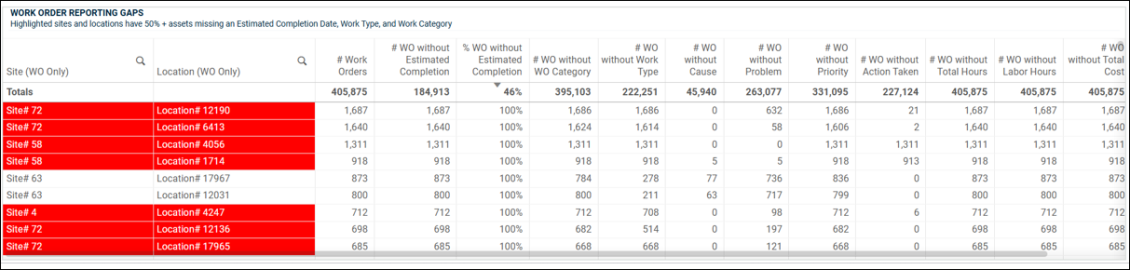
Work Order Reporting Gaps
This chart provides an audit of the availability of work order fields by Site and Location, including the presence of an Estimated Completion Date, a value for various descriptive fields (i.e., Work Type, Work Category, Cause, Problem, Action Taken, and Priority), a value for Cost and Hours, a value for Cost Center, and a value for Project.
Sites and Locations have been highlighted if they have assets where greater than 50% are missing an Estimated Completion Date, greater than 50% are missing a Work Type, and greater than 50% are missing a Work Category. This allows you to quickly identify sites that have work orders that need more attention.